Compounding Builds Roots Before It Shows
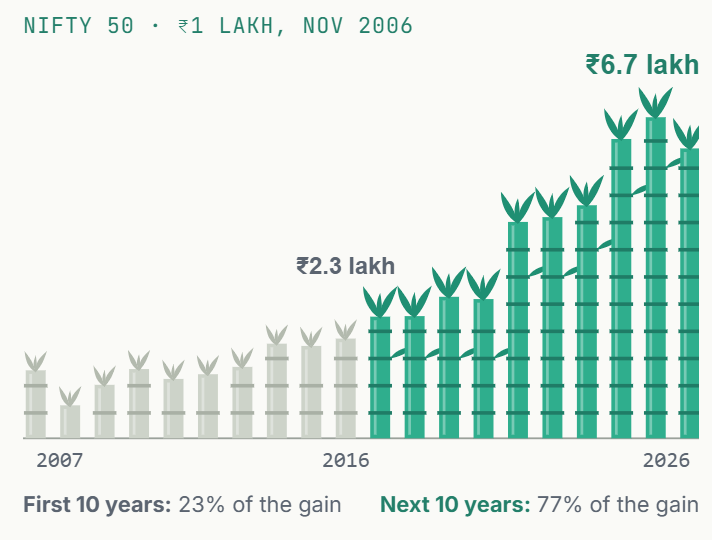
Twenty years of the Nifty 50 turned ₹1 lakh into about ₹6.7 lakh, yet less than a quarter of the gain came in the first decade. That is the arithmetic of compounding, not bad luck. It needs nothing complex, only a long time without interruption, and the same shape shows up well beyond money.
ON THIS PAGE ▾
In November 2006, ₹1 lakh put into the Nifty 50, with dividends reinvested, was worth about ₹2.3 lakh ten years later. By the end of October 2026 it was worth about ₹6.7 lakh. The part I find most instructive is when the gain arrived. Of the roughly ₹5.7 lakh it made, less than a quarter came in the first decade. More than three-quarters came in the second.
Nothing in that result required cleverness. There was no stock picking, no market timing, no leverage and no model. It required owning a broad index, reinvesting what it paid, and not stopping. I've come to think this is the most underrated idea in investing, and in a good deal of life beyond it: the results that matter most tend to come from simple things done for a long time, and they tend to arrive late.
The physicist Albert Bartlett said that the greatest shortcoming of the human race is our inability to understand the exponential function. I'd put it more gently. We understand it fine on paper. What we struggle with is living through the long stretch when it doesn't seem to be working.
Why it feels like nothing is happening
Compounding means earning returns on your returns. Early on, the base is small, so even a good year adds little in absolute terms. Later, the same percentage is applied to a much larger base, and the additions become large. The rate doesn't change. The base does.
It helps to take the market out of it and look at the pure arithmetic. Suppose something grows at exactly 10% a year, every year, with no bad years at all.
- After 10 years it is worth 2.59 times the start.
- After 20 years, 6.73 times.
- After 30 years, 17.45 times.
Even in that frictionless world, the first decade produces only about 28% of the twenty-year gain, and the first two decades produce only about 35% of the thirty-year gain. The faster the rate, the more extreme the effect: at 12% a year, the first decade's share falls to about 24%. So when the Nifty delivered 23% of its gain in the first ten years, that wasn't a story of bad luck followed by good. It was roughly what compounding always looks like, plus one very bad year.
A handy shortcut is the rule of 72: divide 72 by the annual rate to get the years it takes to double. At 10%, that is a little over seven years. Twenty years is close to three doublings, which is why 6.73 times feels so much larger than the 2.59 times you had at the halfway mark. The last doubling is the one that does the work, and you only get it if you were there for the first two.
The often-repeated line that compound interest is the eighth wonder of the world is usually attributed to Einstein, though there's no good evidence he said it. The idea doesn't need a famous name. It needs patience, which is harder to borrow.
What it looked like from the inside
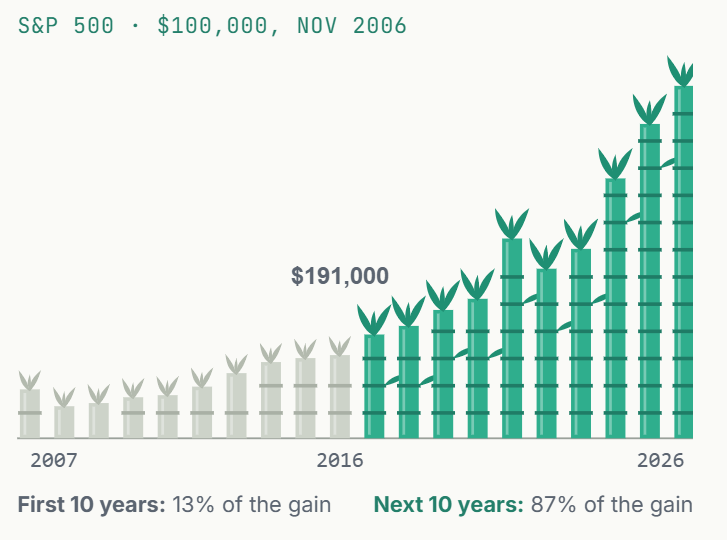
The bamboo charts at the top show both investments a year at a time, measured on or just before 1 November. Averages make compounding look smooth. Living through it was anything but.
The Nifty investor was up 56% after the first year. A year later, in October 2008, the same ₹1 lakh was worth about ₹76,000. Measured daily, the fall from the January 2008 peak to the October low was almost 60%. Five of the twenty November-to-November years were negative, including the most recent one, when the value slipped from about ₹7.4 lakh to ₹6.7 lakh.
The S&P 500 investor had a quieter path but a longer wait. After five years, in November 2011, $100,000 had become about $99,000. Five years of owning the world's most-watched stock market, and less money than at the start. Ten years in, it had nearly doubled to $191,000. Ten years after that, it was $810,000.
Table 1: Two decades, two very different halves
| Investment | Value after 10 years | Value after 20 years | Annualised, first decade | Annualised, second decade | Share of gain in first decade |
|---|---|---|---|---|---|
| Nifty 50 (₹1 lakh) | ₹2.29 lakh | ₹6.66 lakh | 8.6% | 11.3% | 23% |
| S&P 500 ($100,000) | $191,322 | $809,912 | 6.7% | 15.5% | 13% |
| Steady 10% a year (illustration) | 2.59x | 6.73x | 10.0% | 10.0% | 28% |
Source: author's calculations from UTI Nifty 50 Index Fund NAV (AMFI) and the S&P 500 Total Return index (Yahoo Finance), values on or just before 1 November 2006, 2016 and 30 October 2026. The steady-rate row is hypothetical.
Two very different markets, two very different journeys, one shared shape. In both, someone who judged the investment by its first five or ten years would have concluded it wasn't worth the trouble. In both, the reward for staying was larger in the second decade than everything that came before.
The simple part and the hard part
The simple part is genuinely simple. A broad index, dividends reinvested, a long horizon. None of it needs a forecast about which company wins or which way the market moves next quarter. I think people sometimes assume that making money must require something complex, because complexity feels like effort and effort feels like it should be rewarded. Compounding doesn't care how hard you worked. It cares how long you stayed and how little you took out along the way.
The hard part is not interrupting it. Three things interrupt compounding more than anything else:
- Leaving during the bad stretch. The investor who sold in late 2008 locked in the loss and missed the years that did most of the work.
- Starting late, or sitting out. Time is the input you can't buy back. Two flat years in the middle of twenty cost more than they appear to, because they come off the end of the curve, where the additions are largest.
- Costs. They compound too, in the other direction. A small annual cost is barely visible in any one year and very visible after twenty.
Interruptions come off the end of the curve
What 10% a year for 20 years becomes under different interruptions (hypothetical)
- Uninterrupted6.73x
- 1% a year in costs5.60x (−17%)
- Two years at 0% in the middle5.56x (−17%)
- 2% a year in costs4.66x (−31%)
- Starting five years later4.18x (−38%)
| Uninterrupted | 6.73x |
|---|---|
| 1% a year in costs | 5.60x (−17%) |
| Two years at 0% in the middle | 5.56x (−17%) |
| 2% a year in costs | 4.66x (−31%) |
| Starting five years later | 4.18x (−38%) |
Author's illustration: a steady 10% a year, no taxes. Percentages are the shortfall against the uninterrupted result.
Source: Author's calculations.
None of these looks dramatic in the year it happens. Two flat years feel like a pause. A 1% cost feels like a rounding error. Starting a few years later feels like nothing at all. Each of them, quietly, takes a sixth to more than a third off the end result. That is the asymmetry worth remembering: the benefits of compounding are back-loaded, and so are its penalties.
It isn't only money
The same shape shows up almost everywhere something builds on itself.
- Skills and knowledge. Each thing you learn makes the next thing easier to learn. The first years of any craft feel slow, and the later years feel disproportionately productive. That isn't talent arriving late; it's the base finally being large enough to build on quickly.
- Reputation and trust. They accumulate one kept promise at a time and look like nothing for years, until they open doors no single act could. They are also the clearest example of how one interruption can undo a long run of compounding.
- Relationships. Small, repeated contact compounds into the kind of trust that cannot be built in a hurry when you finally need it.
- Health. Daily habits barely register in a week and decide a great deal over a decade, in both directions.
In each case, the early stretch is where most people give up, precisely because it is the stretch with the least to show. The roots are being built where nobody can see them.
Where this could be wrong
- Compounding needs something that compounds. Time alone isn't enough. Japan's Nikkei 225 closed at a record 38,915.87 on 29 December 1989 and did not close above it again until 22 February 2024, about 34 years later. Dividends softened that wait, but the lesson stands: the price you pay and the growth underneath it matter. Patience compounds a good asset; it doesn't repair a bad one.
- Endpoints matter. Change the start or end date and the split between decades changes. A window that began at the 2008 low would look far better, and one that ended in a bad year would look worse. The shape, though, comes from the arithmetic and holds across windows.
- The past is not a promise. India and the US both had strong second decades. There is no guarantee the next twenty years look the same, in either market.
- The data has limits. The Nifty series is an index fund’s NAV after its expenses, used as a stand-in for the total-return index. Neither series includes taxes, and neither involves currency conversion. Both assume a single lump sum rather than regular contributions.
Closing thoughts
The most useful thing I know about compounding is also the least exciting: most of the reward arrives late, so the decisions that matter most are the ones that keep you there long enough to collect it. That rarely calls for anything clever. It calls for an asset worth owning, a cost you barely notice, and the temperament to sit through the years when the roots are growing and nothing seems to be happening above ground.
This article is educational and is not personalized financial advice. Investing involves risk of loss, and past performance does not predict future results. Figures are real index data, not Shipra results: total return in local currency, values on or just before 1 November each year, before taxes. Data as of 30 October 2026.
Related questions
What is compounding in simple terms?
Compounding means earning returns on your past returns, not just on the money you put in. Because each year’s growth is applied to a larger base, the amount added grows over time even if the rate stays the same. That is why compounding looks slow at first and fast later.
Why does compounding take so long to show results?
Early on the base is small, so even good years add little in absolute terms. At a steady 10% a year, only about 28% of a twenty-year gain arrives in the first ten years. Between November 2006 and October 2026, the Nifty 50 earned 23% of its gain in the first decade and the S&P 500 13%.
What stops compounding from working?
Mostly interruptions: selling during a fall, sitting out for a few years, starting late, and costs, which compound against you. At 10% a year for 20 years, a 1% annual cost or two flat years each cuts the end result by about a sixth, and starting five years later cuts it by more than a third.
Sources & references
- UTI Nifty 50 Index Fund, Regular Plan, Growth: NAV history (scheme 100822), AMFI data via mfapi.in
- S&P 500 Total Return index (^SP500TR): historical data, Yahoo Finance
- Japan's Nikkei stock index breaks its 1989 record, surges to all-time high, Business Standard
The materials on this website are for illustration and discussion purposes only and do not constitute an offering. An offering may be made only by delivery of a confidential offering memorandum to appropriate investors. PAST PERFORMANCE IS NO GUARANTEE OF FUTURE RESULTS. Disclosures
Investing in the US, Canada, India, China and Japan involves currency, emerging-market, liquidity and regulatory risks. International and emerging-market risk
More in Education
View all →Howard Marks on AI: 11 Questions Before You Invest
Howard Marks's memo "A Layman Thinks About AI" makes no forecast. It asks eleven questions instead. The odds math says a six-link AI thesis rarely holds in full, concentration and credit exposure are already high, and price, not conviction, is the protection.
Howard Marks on the Investing Mistakes That Never Go Away
Howard Marks's 2005 memo "There They Go Again" lists investing mistakes that return every cycle. We sort them into four families, test them on Indian data from the 2008 crash and October 2026, and turn them into seven questions to ask before you buy.
Rates Are Rising Again: Where Credit Still Offers Value
The Fed hiked to 3.75%–4.00% and the 10-year briefly topped 5%, for different reasons at each end of the curve. Short-duration credit lets you collect the higher yield without forecasting the hard part. Here is how higher rates reshaped high yield, loans, RMBS and CLOs, and where value remains.